Two hours or two minutes
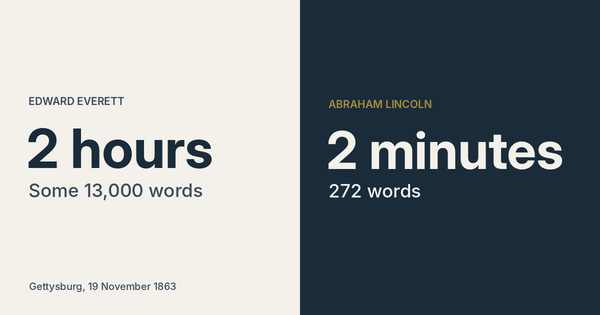
On 19 November 1863 the main speaker at the dedication of the national cemetery at Gettysburg talked for two hours. He was Edward Everett, former senator, former president of Harvard and the most celebrated orator in America. He delivered some 13,000 words from memory. Can anyone quote a single